Author: Jen Schellinck
Principal of Sysabee and an adjunct professor at Carleton’s Institute of Cognitive Science.
In this article, Jen Schellink shares her philosophy to data visualization by describing its purpose for data exploration vs. data communication. Data exploration offers opportunities to identify patterns in the data and develop hypotheses for further investigation. Data presentation (communication) delivers a clear message to the audience through the data visualization. We are to be careful when creating data presentations because the audience may not have context of the data and the takeaway from the visualization is influenced by specific goals.
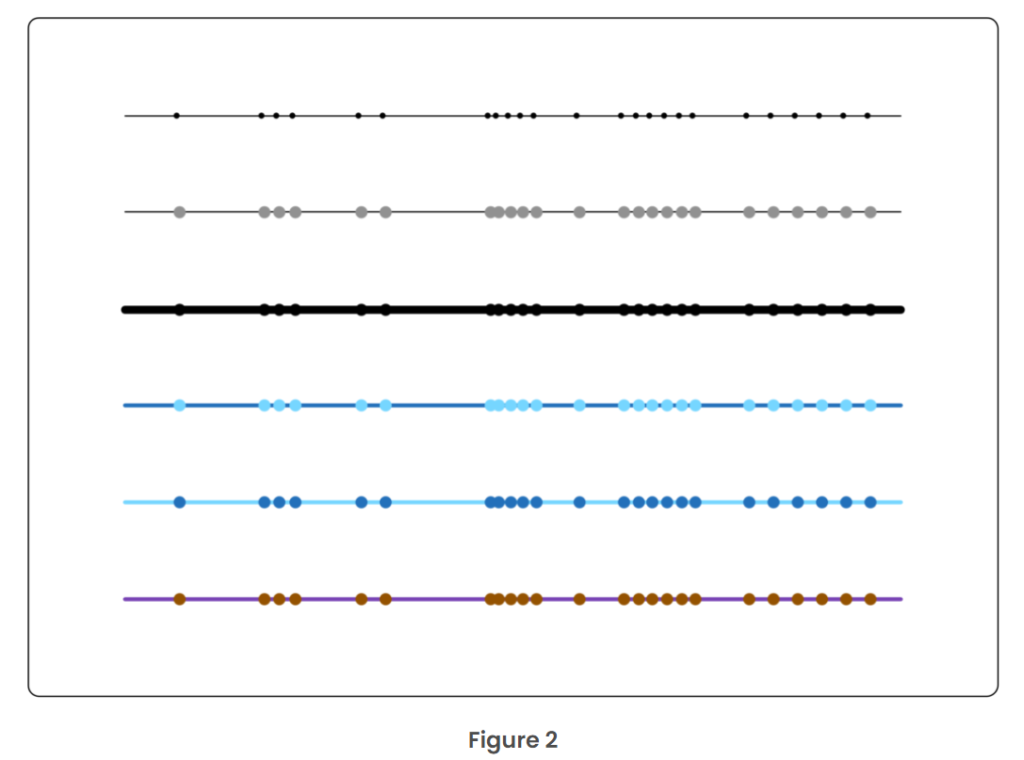
Schellink also speaks about the differences between structural and stylistic elements to data visualization.


Structural design is based on the structure of the data, while stylistic design uses visual elements to shape the interpretation of the data’s structure.
I want to incorporate this Schellink’s philosophy in my visualizing information class to help students understand the differences between data exploration vs. data communication, as well as the process of setting structural elements before diving into stylistic elements.

